What is a good learning visual?
Assume that you are teaching the concept of feedback in online learning, and the different ways that you can design it. You visualize this piece of information as shown in the image below (Visual A and Visual B). Which of these do you think is a better way to visualize this information, and why?
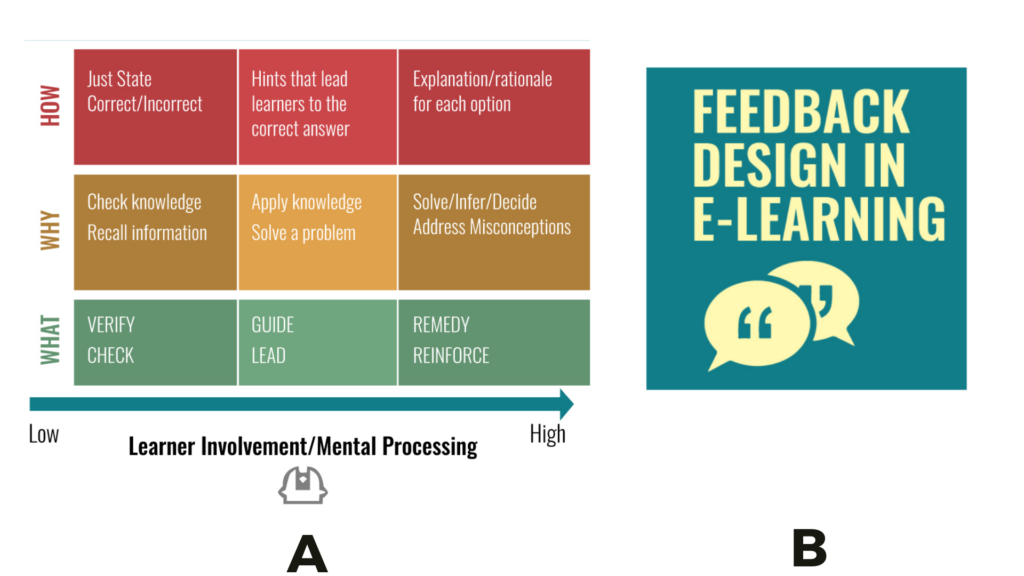
In the first instance, A, there is no icon or symbol, rather the essence of the content has been captured by organizing the various elements, and arranging feedback styles in a continuum (low to high mental processing). In the second instance, B, a simple icon/symbol has been used to visualize the concept of feedback. The first example is more meaningful than the second one because it captures and depicts the relationship between various components that make up the concept of feedback.
In a nutshell, the difference between the two is that the second visual doesn’t help you learn or understand; the first one does.
A good learning visual is one that achieves the following:
- Communicates the essence of the information presented through text
- Lightens text-heavy content and makes the information easy to comprehend
- Retains the key message even when viewed without the accompanying text
Why do we add visuals to learning material
There are two reasons why we add visuals to learning material.
One, part of what makes us human is the need for our brains to search for meaning. This need makes us organize the world around us and our observations into meaningful groups or patterns. When you present complex ideas visually, the patterns within it become apparent and aid comprehension.
Two, our brain processes both verbal and visual information. The two systems that process these are functionally independent – this means that there are two memory stores – a visual one and a verbal one. When we see content with accompanying visuals, two separate memory traces are created in our brains in the two systems. The interesting fact though is that while the memory traces are separate, they are also linked. This increases the chances of recalling and retrieving this information.
Daniel H. Robinson, a professor at the University of Texas says that visuals when used in a supportive way with text1:
- represent the text, providing additional nonverbal memory prompts;
- organize and provide structure and form to text;
- interpret the otherwise complex text; and
- transform text into pictorial images that can be stored more efficiently
Categorizing content from a visualizing perspective
From a visualizing perspective, I find that instructional content may be categorized as follows:

- Tangible Content: Content derived from what is observed around us and is part of the real-world. This sort of content is easy to visualize. Some examples are landscapes and vegetation in geography, body parts in biology, basic mathematical operations, minerals and metals in chemistry and so on.
- Behavioral: Content that addresses the affective domain and manifests as explicit or implicit behaviour, such as teamwork, adaptability, collaboration, interpersonal skills, time management etc.
- Abstract Content: Ideas and descriptions that do not have any physical form. This sort of content is difficult to visualize. Some examples are force in physics; organic chemistry; abstract algebra in mathematics; freedom, liberty and justice in the social sciences; creativity and thinking in education; quality and innovation in business, etc.
We find some abstract concepts “tangible” because we have come to associate these with physical actions or visuals over time. For example, we may find democracy tangible because it has been associated with the physical act of voting, and visuals, such as ballot boxes and party symbols. Similarly, we may find feedback tangible because we associate it with the visual of two people communicating.
Also, when you design instructional content, you will find that the content doesn’t neatly fit into any one single category and that there are always overlaps.
Visualizing the three types of content
Photographs and realistic illustrations can be used to address tangible content. Soft-skills deal with behavior and interactions in specific contexts and can be addressed through scenarios with character illustrations presented through a comic strip or through animations.
It is the third kind of content that most of us struggle with visualizing – the abstract and intangible one. This is why we resort to identifying keywords in a piece of information – one that already has an associated visual. So, in a paragraph that describes what feedback is in an instructional context, and the different feedback styles, the visuals that come to mind immediately are speech blurbs, emoticons and the thumbs up/down symbol. But such visuals do not capture the essence of the content.
Creating meaningful visuals for abstract content
In order to visualize abstract content, you need to perform mental imagery (oops, that’s another abstract concept). Mental imagery is the ability to see pictures and images in your mind when there is no real visual input. Some of us are gifted with this talent; while others have to cultivate it. And the way to cultivate it is to practise, practise, practise. There is no easy formula for this, but let me share what I do to visualize abstract content:
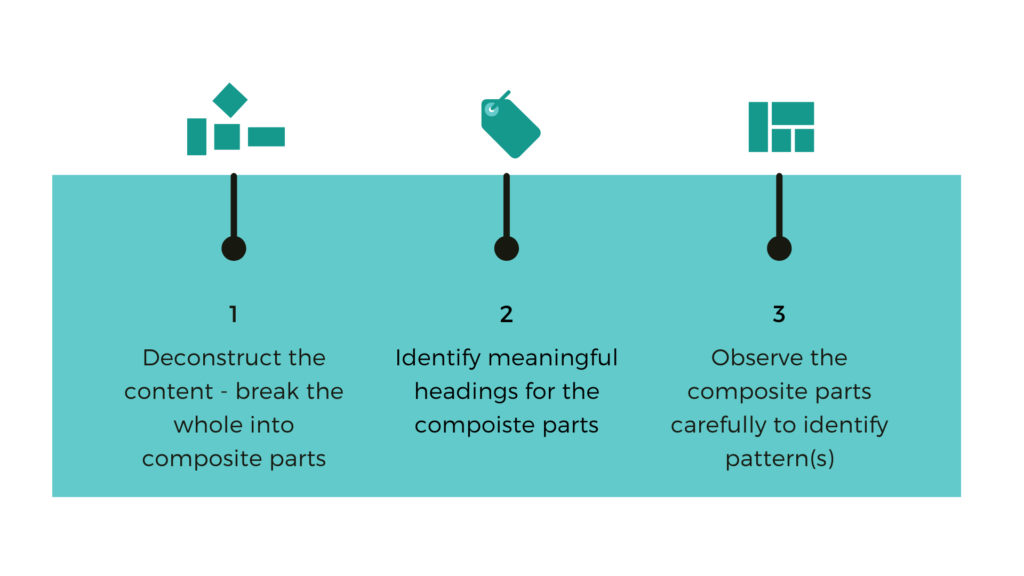
- Deconstruct the content – break the whole into composite parts. So, the composite parts in feedback design for instructional content are: the feedback styles, definition of each style, the reason to select a style, and the manner in which you write each style.
- Identify meaningful headings for the composite parts – definition of each feedback style (What); the reason to select a feedback style (Why); and the manner in which you write each style (How).
- Observe the composite parts carefully to identify pattern(s) – the different styles of feedback require different mental processing, from simple to complex. That’s a continuum; so we place the feedback styles on a continuum!
When you break the entire piece of content into component parts, the abstract concepts become pseudo-objects that you can play around with – allowing you to organize, re-organize and move them around until you find a meaningful way to put them together! The component parts seem like lego blocks, which you put together to create a meaningful shape.
Frameworks to visualize learning material
Ruth Clark has identified a communication taxonomy for learning graphics2, which is as follows:
- Decorative: Add aesthetic appeal or humor
- Representational: Depict an object in a realistic fashion
- Mnemonic: Provide retrieval cues for factual information
- Organizational: Show qualitative relationships
- Relational: Show quantitative relationships
- Transformational: Show changes in objects over time
- Interpretive: Illustrate a theory or principle
There is another one, as I found out recently. D. Hittleman has identified “six styles of illustrations in science texts”3, as described below:
- Photographs: Accurate depictions of a scene or object
- Realistic drawings: Generally related to the object
- Representational drawings: Less accurate than realistic such that some elements or features are highlighted
- Diagrams: Representational but drawing on symbolic representations identifying relationships; may focus on particular elements of a whole
- Charts, graphs and figures: Information organised spatially, representing relationships in various ways
- Maps: Representation of some physical reality with some topology or spatial structure
This seems to be provided specifically for science text, but I think it could be quite useful in other disciplines as well.
There’s more…..
What I have addressed here is just the tip of the iceberg. There is much more to graphic design than the pictures, photographs, diagrams and illustrations that we instructional designers identify. Many psychological principles impact visual design, and one can take a complete course on that!
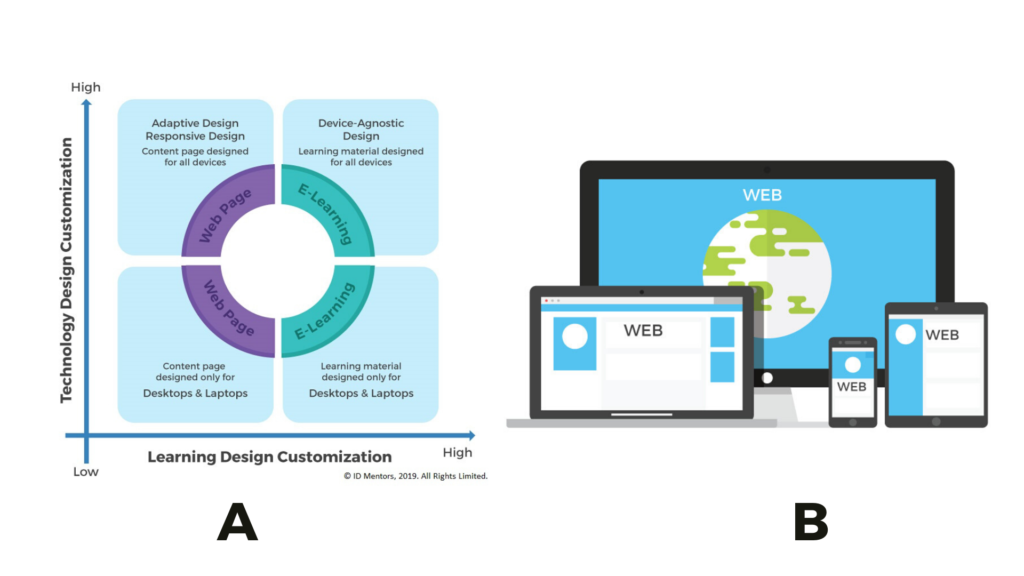
Which of these is a better learning visual?
Let me leave you with a question. Suppose you are explaining the concept of device-agnostic learning design in a course meant for instructional designers. Which one of these would be a more meaningful visual to accompany the explanation text?
References
1,3Source: The importance of diagrams, graphics and other visual representations in STEM teaching [Retrieved: 12th March, 2020]
2Source: More than Eye Candy [Retrieved: 12th March, 2020]
2 responses on "Visualizing Instructional Content"
Leave a Message
You must be logged in to post a comment.
![]()
Tools
Type
Companies
Very useful information! Often while dealing with the corporate learning, IDs tend add content as a paragraph or simply break it into points. This article will help to know how to break content to use correct visuals and make it crisp.
Good one as always! 🙂